Your Dashboard Is Lying - Retail Media Standardization Crisis
Uncover why impressive retail media dashboard metrics like high ROAS and new-to-brand rates can be misleading, how inconsistent measurement definitions skew performance evaluations, and how enforcing industry standards can unlock real, incremental growth.
Watch the Full Episode
Dive deep into the insights and discover what really drives growth
Your Dashboard Is Lying - Retail Media Standardization Crisis
Uncover why impressive retail media dashboard metrics like high ROAS and new-to-brand rates can be misleading, how inconsistent measurement definitions skew performance evaluations, and how enforcing industry standards can unlock real, incremental growth.
Everything You Need to Know
Go beyond the video with detailed insights, actionable takeaways, and expert analysis.
Executive Summary
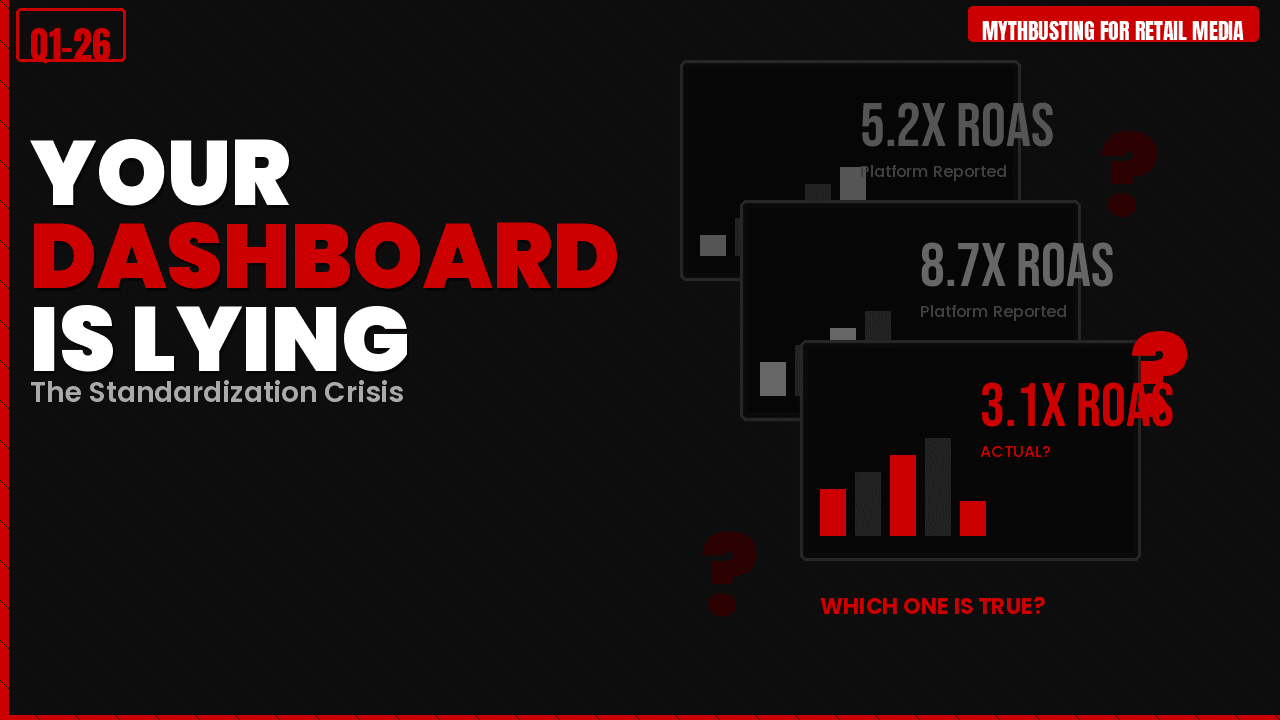
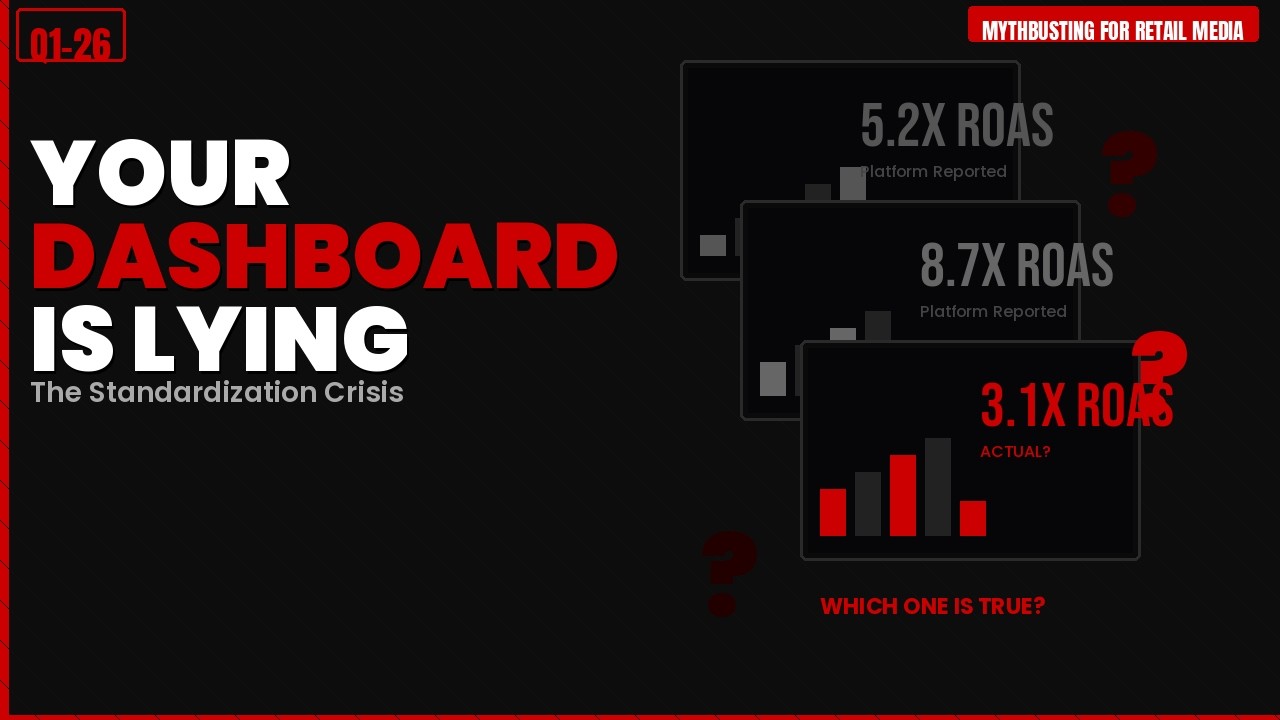
In this episode, we reveal how common retail media reporting practices can create a deceptive view of campaign success — one that looks great on paper but doesn't align with actual business performance. Marketers often celebrate metrics like 9.1X ROAS and 35% new-to-brand customers, only to discover that much of that reported impact is phantom revenue driven by inconsistent definitions and inflated dashboards.
The Phantom Revenue Problem
Imagine wrapping up a quarterly review with retail partners on a high note — dashboards flashing 9.1X ROAS from Kroger and 35% new-to-brand from Target, with a blended 7.6X return. It feels like a major win, until the finance team asks the hard question: If all that revenue was real, why didn't net profit go up? The uncomfortable answer is that much of what marketers celebrate is phantom revenue — numbers that look good but don't hold up under scrutiny.
Three Root Causes of Dashboard Distortion
The root cause lies in a lack of standardization. Retailers use different definitions for basic metrics, creating a fog of confusion where numbers aren't comparable and often inflated.
1. Gross vs Net Sales Reporting
Industry standards, such as those recommended by the IAB, require reporting net sales — sales after returns, cancellations, and refunds. However, many retailers report gross sales, which boosts the topline figures but doesn't reflect money that actually stays in the bank. For a beauty brand that audited its partner reports, this practice resulted in a 22% overstatement of revenue due to an 18% return rate.
2. Inconsistent Attribution Windows
Attribution windows — the period after an ad interaction during which a retailer claims credit for subsequent purchases — vary wildly across networks. While the IAB suggests a standard 30-day window, actual retailer practices differ enormously. One scenario showed how the same user journey was credited with $42 in revenue under a seven-day window but ballooned to $387 under a 365-day window — a 9X difference from the same ad click.
3. Misleading New-to-Brand Definitions
While the IAB recommends using consistent look-back periods to identify truly new customers, some retailers define "new" in ways that artificially inflate acquisition metrics — such as labeling someone who simply bought a different flavor of a product as new. A case where a partner claimed a 73% new-to-brand rate was revealed on audit to actually be just 18% truly new customers, with the rest being existing customers purchasing a variant.
The Real-World Impact
These measurement inconsistencies aren't trivial — they directly impact budget decisions and can divert millions of dollars to partners who are gaming the definitions. One major CPG brand audited its partners and found that after correcting for inflated metrics, they reduced $18.6 million in wasted budget and reallocated it to transparent partners. The result? With the same total spend, the brand generated an additional $33 million in real incremental growth — all by demanding standardized, verifiable measurement.
The Four-Step Framework
To fight back against misleading dashboards:
- Define clear measurement standards (e.g., IAB) across all partners.
- Demand full methodological transparency from every retail media partner.
- Verify claims with independent tests — don't take dashboard numbers at face value.
- Enforce accountability through contract clauses such as budget contingencies tied to verified performance.
The Bottom Line
Dashboard metrics alone can be dangerously misleading if they rely on inconsistent or inflated definitions. By enforcing standardized measurement practices, demanding transparency, and auditing partner reporting, brands can cut wasted spend, reallocate to high-integrity partners, and unlock substantial incremental growth.
"The most dangerous metric is one that looks precise but means something different everywhere you see it."
Key Takeaways
Retail partner dashboards often report inflated metrics due to inconsistent definitions of sales, attribution windows, and new-to-brand customers
Gross sales reporting can overstate actual revenue when returns, cancellations, and refunds aren't deducted
Varying attribution windows (7 days vs 365 days) can create massive differences in credited revenue from the same user behavior
Misleading definitions of new-to-brand customers can vastly overstate acquisition performance
Auditing and enforcing standardized measurement definitions can improve transparency and profitability
A four-step framework — define terms, demand transparency, verify results, enforce contracts — helps brands uncover real incremental value
Continue Your Learning Journey
Explore more myth-busting series and uncover the truths that drive sustainable growth

Beyond the 5-Year Lookback: Why Incrementality and Category Growth Drive Real Marketing Impact
Discover why extended historical data windows risk over-emphasizing the past at the expense of what truly matters today: incrementality, category dynamics, and forward-looking growth levers.

Beyond PDP Optimization: Why Price-Pack Architecture is the Real Growth Lever
Discover why no amount of SEO copywriting or keyword targeting can fix a fundamental issue: selling the wrong pack at the wrong price. Learn how Price-Pack Architecture drives both category growth and brand profitability.

Category Momentum > Last-Click Sales
Discover why retail media budgets allocated based on last-click attribution are reactive and starve emerging opportunities. Learn how Category Momentum drives proactive growth strategy.

Creative is the Bottleneck and AI is the Unlock
Discover why the true bottleneck for retail media performance isn't algorithms or budgets, it's creative relevance. Learn how AI enables faster, cheaper, and more adaptive creative pipelines.